Recognising uncertainty in statistics
Data on killings in the Syrian conflict.

Context
Background
There are several organisations who are monitoring casualties in Syria – including, but not limited to:
- March 15 Group
- Syrian government
- Syrian Center for Statistics and Research
- Syrian Network for Human Rights
- Syrian Observatory for Human Rights
- Syrian Revolution General Council
- Syria Shuhada Website
- Violations Documentation Centre, the documentation arm of the Local Coordination Committees
- Damascus Center for Human Rights Studies
Figures released by all of the above parties (some of whom are no longer collecting up to date data) differ greatly. As an example, in 2013 the Syrian Observatory for Human Rights (SOHR) enumerated estimated that the total number of people killed was 110,371 people.
They even released more disaggregated figures along with this estimation:
| Civilians killed | 40146 |
|---|---|
| of which: | |
| Women | nearly 4000 |
| Children | more than 5800 |
| Rebel fighters | 21,850 |
| Regime army soldiers | 27654 |
| Pro-regime militia | 17824 |
| Hezbollah | 171 |
| Unidentified | 2726 |
As Root identifies, the disaggregated categories within the data are also subject to a lot of human decision making:
Imagine the decision that might have to be made to categorize a typical citizen with no military training, who has picked up a gun shortly before his death. Perhaps the coder might have a bias to continue calling this person a civilian. But this person took up arms against the government, did they not? How would you code a Syrian army defector now fighting with an opposition group? … Without some sort of standard protocol, rigorously followed, the coding of affiliation allows for a degree of subjectivity… – Brian Root, Numbers are Only Human, page 6
As he rightly identifies – there are lots of human decisions that go into creating these statistics, and without knowing how these deaths have been coded, it’s difficult to trust in the figures. But this nuance can be difficult to convey without using long-winded explanations, and sadly, soundbites of short, snappy figures, often get much more traction in public debate. (see Reflection Story #6 for more on this.)
The messiness of the Syrian conflict adds to this confusion in coding; it can easily be unclear who is responsible for a certain attack, especially those which nobody wants to take responsibility for, such as chemical weapons attacks.
As Anita Gohdes, researcher at the Human Rights Data Analysis Group, highlights: in addition to the problem of subjectivity and human judgement, this level of disaggregation can convey a false sense of accuracy. Breaking down figures to such precise levels – “21,850 rebel fighters” rather than “Approximately 22,000 rebel fighters” removes the sense of uncertainty that is undoubtedly there.
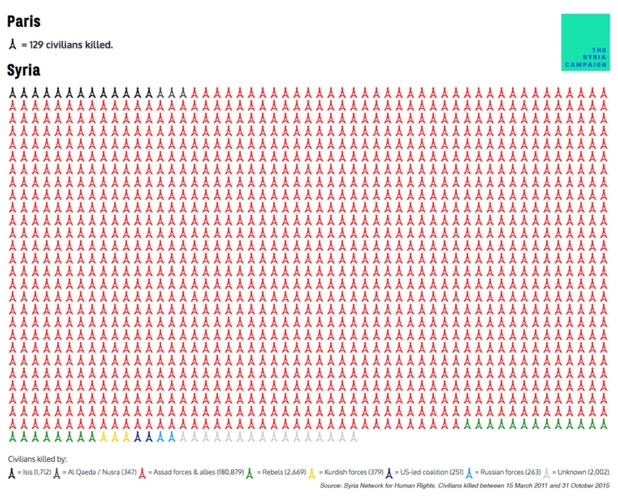
Image from the Syria Campaign: https://thesyriacampaign.org/
It’s true though, that images such as the visualisation above draw attention to some important issues. Though they state their data source (the Syria Network for Human Rights) what we’ve explored here so far makes it clear that this data has flaws. We can’t know for sure the extent of those flaws, though, and some might argue that as long as the main message is transmitted, the details don’t matter so much.
A data-focused group, the Human Rights Data Analysis Group (HRDAG), published in mid 2013 a statistical analysis of documentation of killings in Syria, commissioned by the Office of the UN High Commissioner for Human Rights. In it, they integrate findings from eight different databases; seven built by Syrian human rights monitors, and one from the Syrian government.
In it, they qualify carefully their findings; that the final figure they came up with, 92,901 unique killings of both combatants and non-combatants, is an enumeration and not the complete number of conflict-related killings. They identify potential problems like undetected duplicate deaths among the different databases; inaccurate records within any of those databases; victims presumed dead who may have later been found alive; or, undocumented killings, those that don’t appear in any of the the eight databases for any number of reasons, to name just a few.
To highlight the problems that they discuss, take a look at the graph below. It shows the daily count of uniquely reported killings in the area of Tartus, as collected by four well-known data sources.
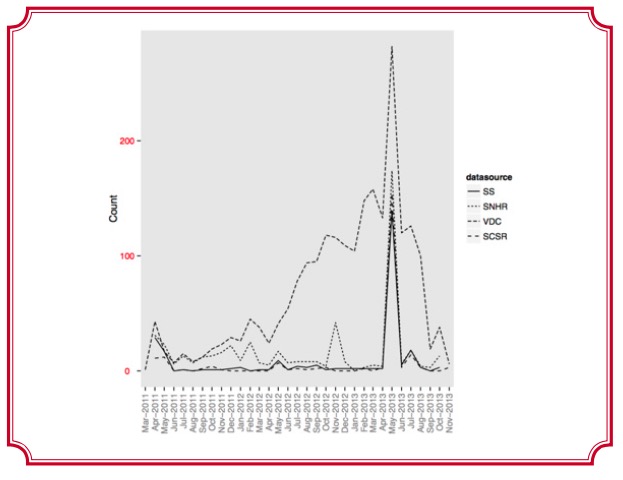
Caption: image taken from ‘Searching for Trends: Analyzing Patterns in Conflict Violence Data’
post by Megan Price and Anita Gohdes, copied here with permission
As you can see, there are some big discrepancies in the data, notably leading up to May 2013.
the challenge: admitting weaknesses in the data, while pushing a strong message
As HRDAG and Brian Root at Human Rights Watch have identified, getting “accurate” data on killings in the Syrian conflict is incredibly challenging. Any and all of the major data sources face uncertainties in getting the data, in coding it accurately according to type of death or killing, and in comprehensive data coverage of hard to reach areas. In short; none of the data is certain accurate enough to be cited as “truth” or :fact.
It’s true, though, that data on the topic is very much needed for a number of reasons; in order to get an idea of the scale of the conflict, to understand what humanitarian needs there are; and on the advocacy side, to get people’s attention to a tragic situation, and garner public support.
There are many ways of counting deaths in conflicts that have already ended, as outlined in this Guardian article – and even when they have ended, there is still a great deal of uncertainty around the accuracy and subjectivity of that data. This challenge is even greater in the case of Syria, where the conflict is ongoing and increasingly messy between different stakeholders.
The main challenge in this case is knowing where to draw the line between using quantitative data to strengthen advocacy, or where to admit uncertainty and potentially weaken the key advocacy message.
ways of dealing with uncertainty
The Human Rights Data Analysis Group are pioneering the way in collecting and analysing figures of killings in conflict in a responsible way, using what’s called ‘multiple systems estimation’. But it’s true that the statistical skills required to use these kinds of techniques may well lie far beyond the reach of many advocacy groups, and in this case, there are a few other considerations and techniques that can be employed:
- questioning methodologies of how the data has been gathered and analysed – for example, who decides what code is given to a data point? What levels of verification do they have in place?
- making proactive decisions around whether to include or focus upon a certain statistic as part of the advocacy, or to include qualifiers about how reliable it may or not be (eg. adding ‘estimated as of __’)
- linking to other sources of deeper enquiry of the reliability or consistency of the data (eg. in this case, the HRDAG study linked above)
Clearly, with an issue as complex yet important is this – and, as with many of the reflection stories- there is no right answer. At the heart of mitigating against misunderstandings of data is increasing the level of data literacy of those who will be looking at the visualisations, but this is easier said than done.